Breaking down why Timber speeds up ML models so much
A practical breakdown of the Timber compiler. Using repo-level evidence, we explain why Timber can push classical ML inference into microsecond territory and where the speedup really comes from.
This is the compressed version, in the spirit of a good high-signal Threads post.
• Timber is not an LLM accelerator. It is a compiler for classical ML inference. [4][5]
• The speedup comes from a simple idea executed well: parse the trained model once, optimize the graph once, emit native C once, then skip the Python-heavy hot path forever. [4][5][6][7]
• Its own benchmark headline is strong: ~2 microseconds single-sample inference, ~336x faster than Python XGBoost, and a ~48 KB compiled artifact in the reference setup. [4]
• The repo-level reasons are concrete: dead leaf elimination, threshold quantization, branch sorting, pipeline fusion, flat array tree layout, no heap allocation, no recursion, contiguous float32 inputs, and direct
ctypescalls into compiled code. [5][6][7]• The caveat matters: the benchmark is in-process single-sample latency, not end-to-end network serving. The numbers are real for that setup, but they are not a universal production promise. [8][9]
The first important correction is conceptual. Timber is not just another Python package that wraps XGBoost and calls it faster. The repo presents it as a multi-stage compiler for classical ML models. The supported inputs are XGBoost, LightGBM, scikit-learn, CatBoost, and ONNX for trees, linear models, and SVMs. The output is a self-contained C99 inference artifact with zero runtime dependencies. [4][5]
That architecture matters because it changes where the cost lives. A lot of model-serving latency in common Python stacks is not the math itself. It is the combination of Python runtime overhead, framework abstractions, object dispatch, memory layout mismatches, and general-purpose serving layers around the model. Timber attacks that whole stack by compiling the model into a simpler execution path. [4][5][7]
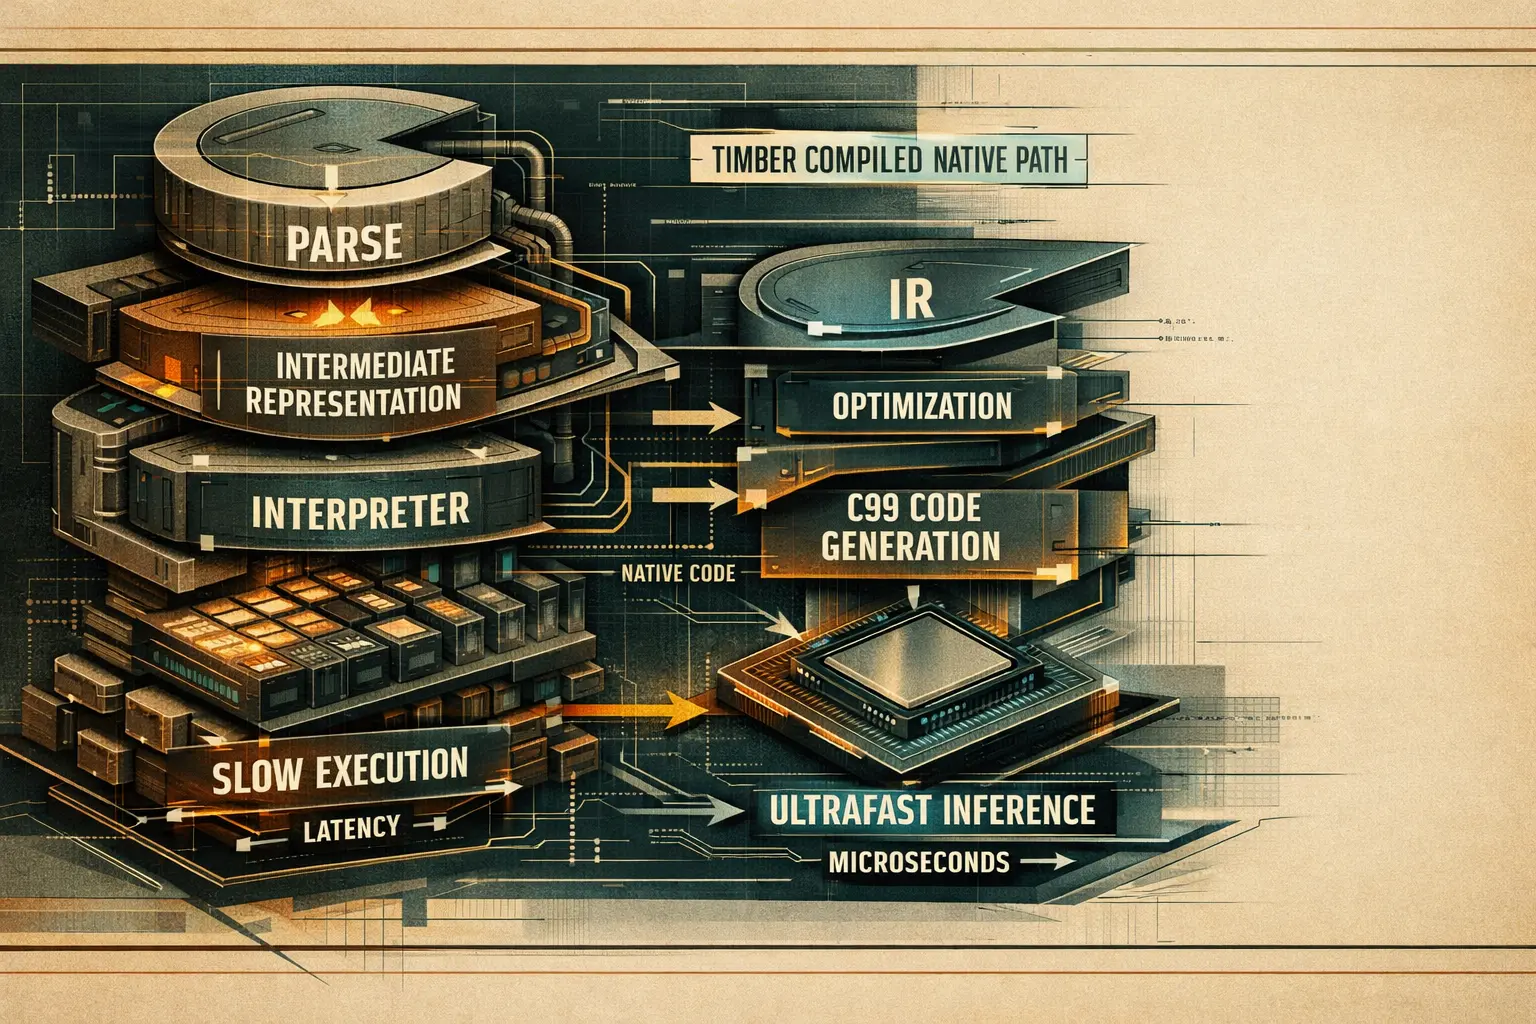
The repo's own high-level flow is explicit: frontend parser -> Timber IR -> optimizer passes -> backend emitter -> native compile -> thin serve path. That is a much more aggressive move than just exporting to another runtime. [5]
Timber's architecture is compiler-shaped on purpose. That is the core reason the latency profile changes so much. [5]
Section what-timber-is screenshotNo single trick explains the result. The gain comes from several choices that remove runtime work layer by layer.
1. It deletes useless branches before you ever call predict
The optimizer pipeline runs passes such as dead leaf elimination and constant feature detection. If both branches of a node collapse to the same result, that node becomes a leaf. If calibration data proves a feature is effectively constant, Timber can route directly to the deterministic child. Less branching means less work at inference time. [6]
2. It folds preprocessing into the model itself
One of the most important passes is pipeline fusion. When a scaler stage sits directly before a tree ensemble, Timber rewrites the tree thresholds and removes the scaler computation from runtime entirely. That is an unusually strong optimization because it erases a whole preprocessing stage, not just a few instructions. [5][6]
3. It optimizes the shape of branches for the CPU
With calibration data available, Timber can reorder left and right children so that the more frequent path becomes the natural branch direction. This is small on paper, but hot inference loops are exactly where these branch-prediction wins add up. [5][6]
4. It narrows data where it is safe
Threshold quantization attempts to downcast float64 thresholds to float32, but only when calibration data shows no decision change. That reduces model size and can improve cache behavior without silently changing predictions. [5][6]
More work upfront
Timber spends effort once during parse and optimization so that inference time does less work. [5][6]
Flat static arrays
Nodes are stored as array data, not pointer-heavy heap structures, which improves locality and removes allocation overhead. [5]
No recursion
Generated traversal is iterative and bounded, which is cheaper and safer for tight loops and embedded targets. [5]
Thin ctypes bridge
Numpy arrays are converted to contiguous float32 and passed as raw pointers into compiled code. [7]
The repo code is worth reading because the performance story is not marketing-only. The optimizer orchestration in timber/optimizer/pipeline.py makes the sequence explicit: dead_leaf_elimination, constant_feature_detection, threshold_quantization, optional frequency_branch_sort, pipeline_fusion, and then vectorization_analysis. The order is logical. First simplify the tree structure, then shrink representation, then improve branch direction, then fuse stages. [6]
The runtime path in timber/runtime/predictor.py is equally telling. Inputs are coerced into contiguous float32 numpy arrays. Outputs are preallocated. The predictor obtains raw pointers with .ctypes.data_as(...) and calls timber_infer or timber_infer_single directly. There is no Python object choreography in the hot path beyond marshaling arrays once. [7]
A short excerpt from the flow looks like this:
X = np.ascontiguousarray(X, dtype=np.float32)
outputs = np.zeros((n_samples, self.n_outputs), dtype=np.float32)
inputs_ptr = X.ctypes.data_as(ctypes.POINTER(ctypes.c_float))
outputs_ptr = outputs.ctypes.data_as(ctypes.POINTER(ctypes.c_float))
rc = self._lib.timber_infer(inputs_ptr, n_samples, outputs_ptr, self._ctx)
That is a very different path from staying inside a full Python ML framework for every single prediction. The point is not only native code. The point is native code plus a drastically thinner call chain. [7]
The architecture doc also states that generated C uses static const arrays, no heap allocation, no recursion, and double-precision accumulation where needed for numerical stability. So Timber is not trading speed for obvious correctness shortcuts. [5]
The repository does something many performance projects skip. It exposes the benchmark methodology in plain code. The benchmark runner trains a reference XGBoost classifier on sklearn.datasets.load_breast_cancer, using 50 trees, max depth 4, 30 features, 1,000 warmup iterations, and 10,000 timed single-sample predictions. It measures mean, p50, p95, p99, and throughput in microseconds. [8][9]
| Runtime | Headline from Timber docs | What it actually represents |
|---|---|---|
| Timber native C | ~2 microseconds | In-process, single-sample inference through compiled native code. [4][8][9] |
| Python XGBoost | ~670 microseconds | Python baseline in the same benchmark script. [4][9] |
| Treelite | ~10 to 30 microseconds | Optional compiled baseline if installed. [4][8] |
| ONNX Runtime | ~80 to 150 microseconds | Optional baseline in the benchmark docs. [4][8] |
| HTTP serving overhead | Not included in the headline | README explicitly says network overhead adds roughly 50 to 200 microseconds depending on stack. [4] |
That last row is why serious readers should not overclaim. Timber's benchmark is still useful because it isolates the inference engine itself. But if you later put the model behind a real API gateway, JSON serialization, auth, queues, and cross-process hops, the end-to-end latency budget changes. [4][8]
The architecture is strong, but it is not universal magic.
Strong fit
Not a direct fit for everything
Benchmark discipline still matters
No. The repository is focused on classical ML families such as tree ensembles, linear models, and SVMs. The optimization story in this article is tied to those structures, not to every model type. [4][5]
Not on its own terms. The repo documents a reference benchmark where Timber native inference is about 336x faster than Python XGBoost. The important nuance is that this is in-process single-sample latency, not full network request latency. [4][8][9]
The biggest reason is that Timber shifts work from runtime into compile time. It parses the model into its own IR, runs optimizer passes, emits C99, and then serves a much thinner native inference path. [5][6][7]
Benchmark your real request path, not just model inference in isolation. Measure in-process latency, network overhead, serialization cost, batch shape, and concurrency behavior on your own hardware. The repo itself encourages publishing methodology and hardware details alongside numbers. [8][9]
Primary sources and repo files used for the factual parts of this article. The Threads link below is included as context for the framing, not as the evidence base for the technical claims.
Related Articles
AI Assistant Development Cost in 2026: RAG Chatbots, CRM Integrations, Guardrails, and Support
A practical buyer guide to AI assistant development cost in 2026: prototypes, RAG chatbots, knowledge-base assistants, CRM and website integrations, guardrails, evaluations, monitoring, and support.
AI-assisted attacks and prompt injection in 2026: the new attack surface for AI products
AI-assisted attacks and prompt injection in 2026: the new attack surface for AI products. A practical PAS7 Studio security guide with threat model, controls, rollout checklist, pitfalls, and sources.
AI for landing page development: where it speeds up launches and where it hurts conversion
A practical research piece on using AI for landing page development: v0, Webflow AI, Builder.io, Framer-like builders, UX generation, copy, SEO, personalization, A/B testing, template risk, accessibility, security and technical debt.
AI SEO / GEO in 2026: Your Next Customers Aren’t Humans — They’re Agents
Search is shifting from clicks to answers. Bots and AI agents crawl, cite, recommend, and increasingly buy. Learn what AI SEO / GEO means, why classic SEO is no longer enough, and how PAS7 Studio helps brands win visibility in the agentic web.
Professional development for your business
We create modern web solutions and bots for businesses. Learn how we can help you achieve your goals.